Black, Latino, White, Asian, and Pacific Islander high-school students studying human geography

Human Geography

Explore how people, culture, movement, and environments shape our world.

Human Geography

Human geography studies the relationships between people and places. Learners examine how populations move, how cultures develop, how cities grow, and how people interact with natural and built environments.

Unit 1 - Thinking Geographically

Begin with the tools geographers use to understand location, patterns, and connections. Each lesson opens as a separate activity.
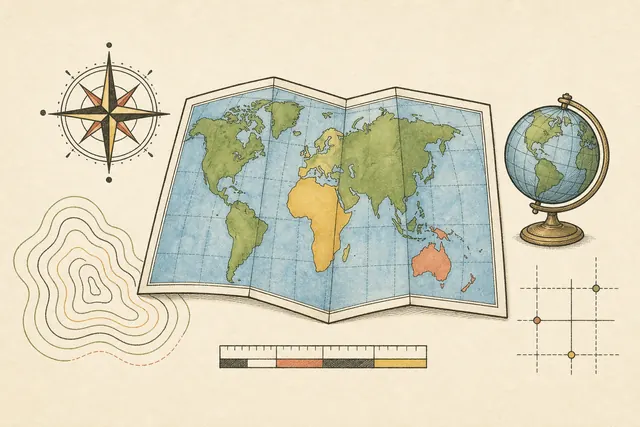
Line-art illustration of a world map, compass rose, globe, contour lines, and map scale
Lesson 1.1
Introduction to Maps
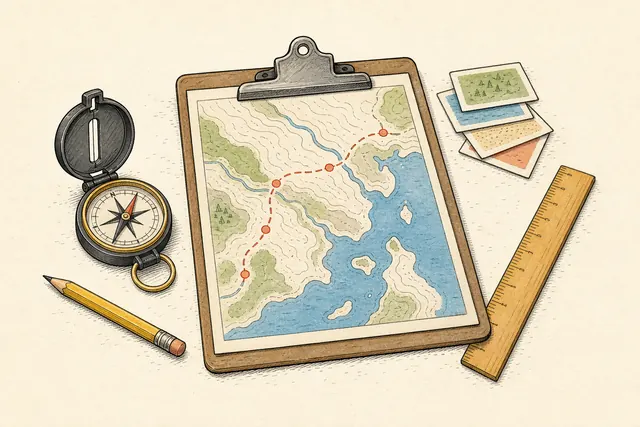
Line-art illustration of a map-skills lab with a clipboard, compass, ruler, and route
Lab 1.1
Human Geography Lab: Introduction to Maps
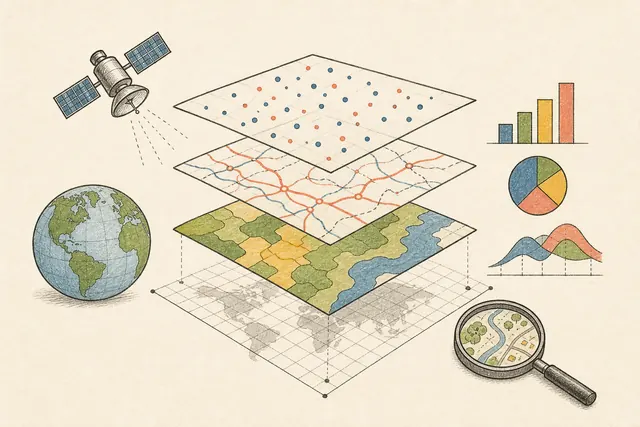
Line-art illustration of geographic data shown as layered GIS maps, a satellite, and charts
Lesson 1.2
Geographic Data
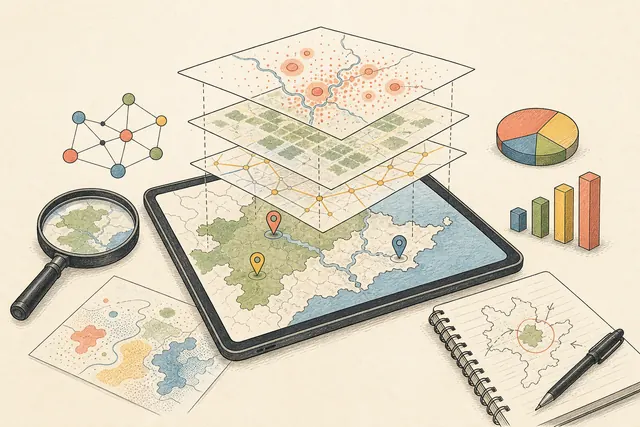
Line-art illustration of a geographic-data lab with map overlays, location pins, and charts
Lab 1.2
Human Geography Lab: Geographic Data
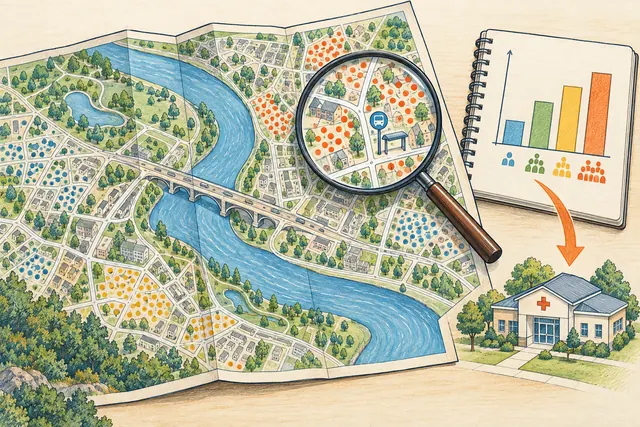
Illustrated city map, population data, and a community clinic showing how geographic information guides decisions
Lesson 1.3
The Power of Geographic Data
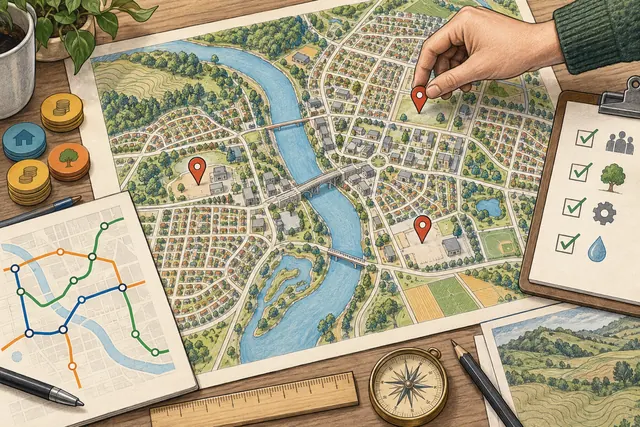
Illustrated map, transit route, and budget tokens for hands-on geographic decision challenges
Lab 1.3
Human Geography Lab: The Power of Geographic Data
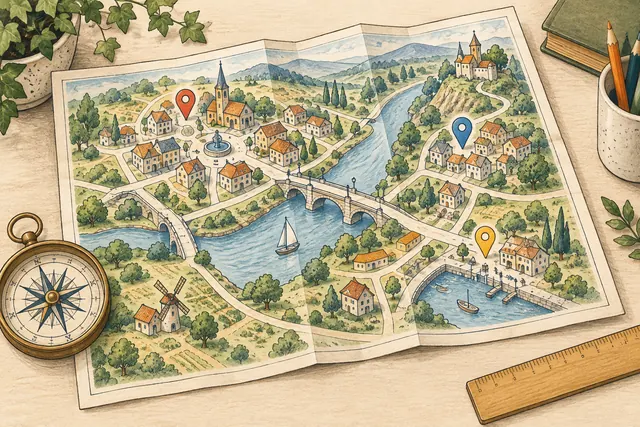
Hand-drawn town map with a river bridge, connected streets, location pins, compass, and ruler
Lesson 1.4
Spatial Concepts: Where, Why There, and How Connected?
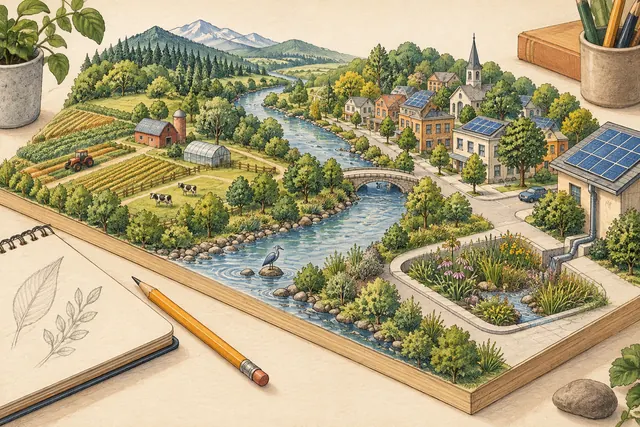
Hand-drawn landscape showing a riverside town, solar panels, fields, trees, and a rain garden
Lesson 1.5
Human–Environmental Interaction: Nature Sets Conditions. People Make Choices.
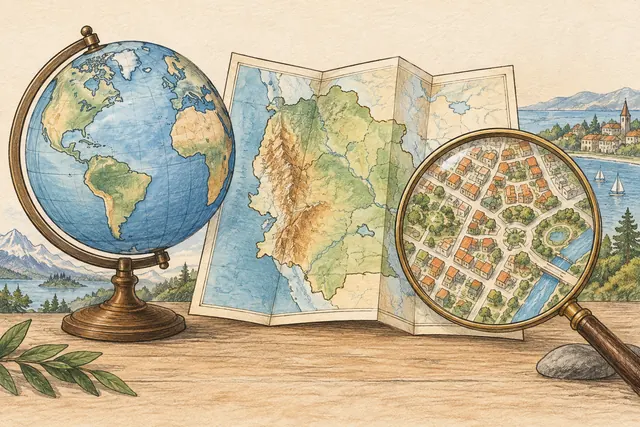
Hand-drawn globe, country map, and magnified neighborhood showing different scales of analysis
Lesson 1.6
Scales of Analysis: Zoom Out. Look Closer. Change the Story.
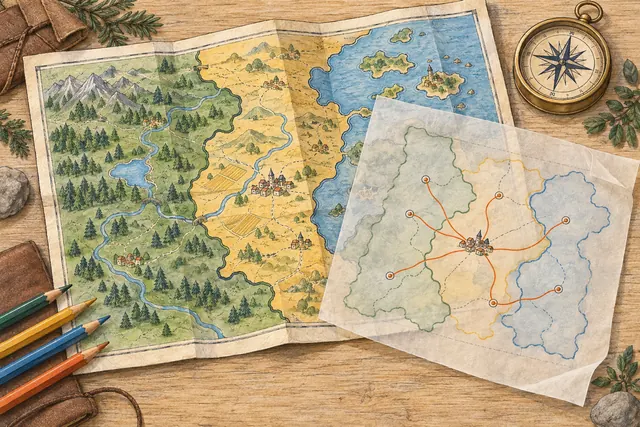
Hand-drawn regional map with overlapping boundaries and towns connected by routes
Lesson 1.7
Regional Analysis: Same Places. Different Regions.

Unit 2 - Population and Migration Patterns and Processes

Explore where people live and how population patterns affect services, resources, and decisions. Each lesson includes five visual simulations, saved progress, and a score out of 20.
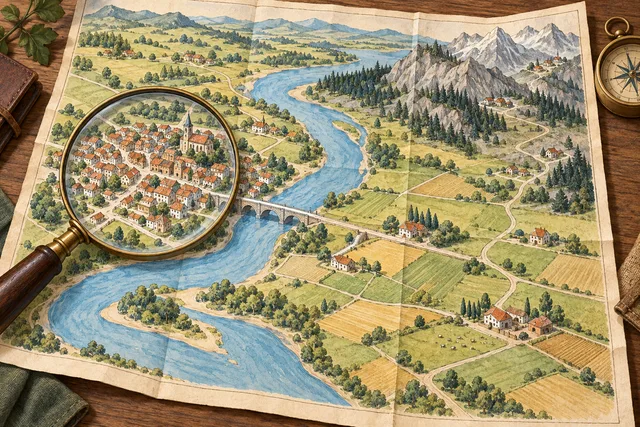
Watercolor map showing a clustered riverside town, scattered farms, and mountain settlements
Lesson 2.1
Population Distribution
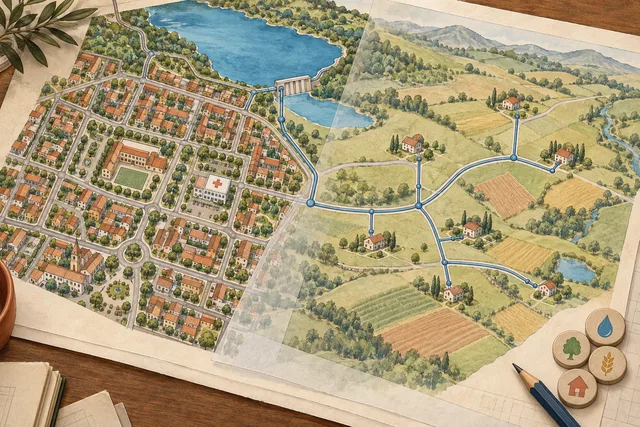
Watercolor planning map connecting urban and rural homes with a school, clinic, reservoir, and water network
Lesson 2.2
Consequences of Population Distribution
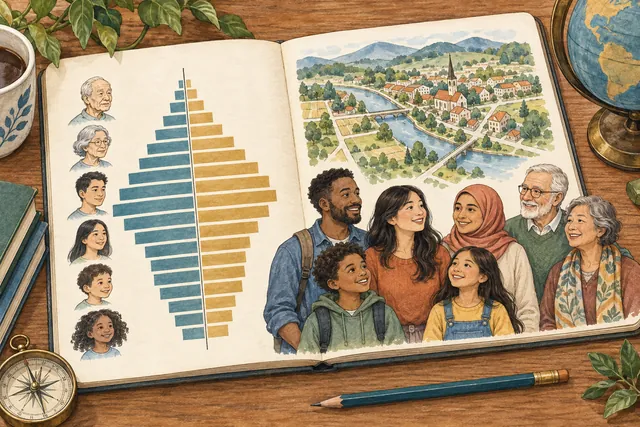
Ink-and-watercolor illustration of a population pyramid, town map, and people of different ages
Lesson 2.3
Population Composition
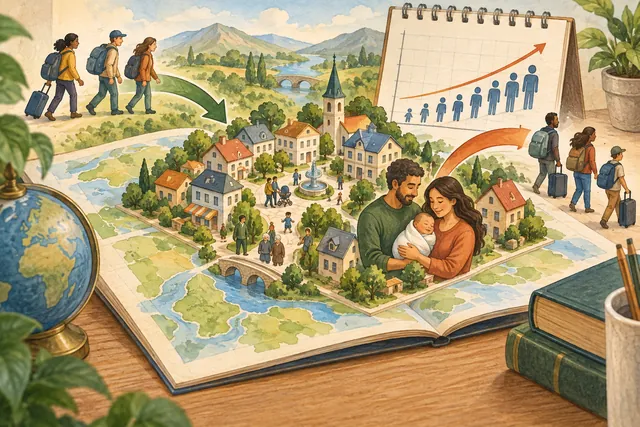
Ink-and-watercolor illustration of a growing town, families, migration arrows, and a population curve
Lesson 2.4
Population Dynamics
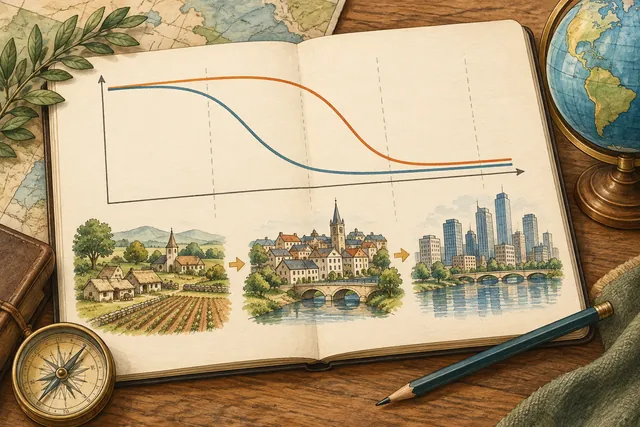
Ink-and-watercolor illustration of demographic transition curves and settlements changing from village to city
Lesson 2.5
The Demographic Transition Model
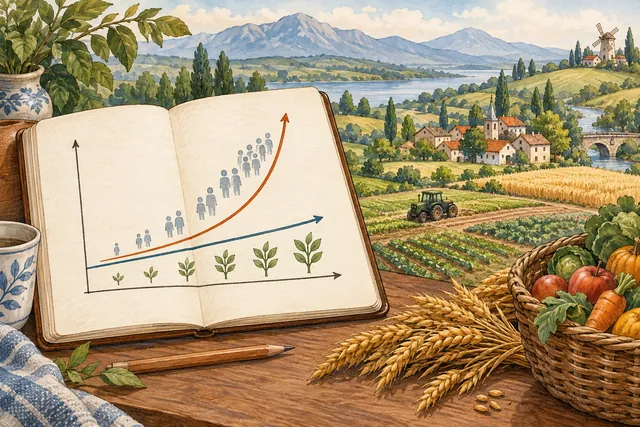
Ink-and-watercolor illustration of population and food-supply curves, crop fields, and agricultural technology
Lesson 2.6
Malthusian Theory